
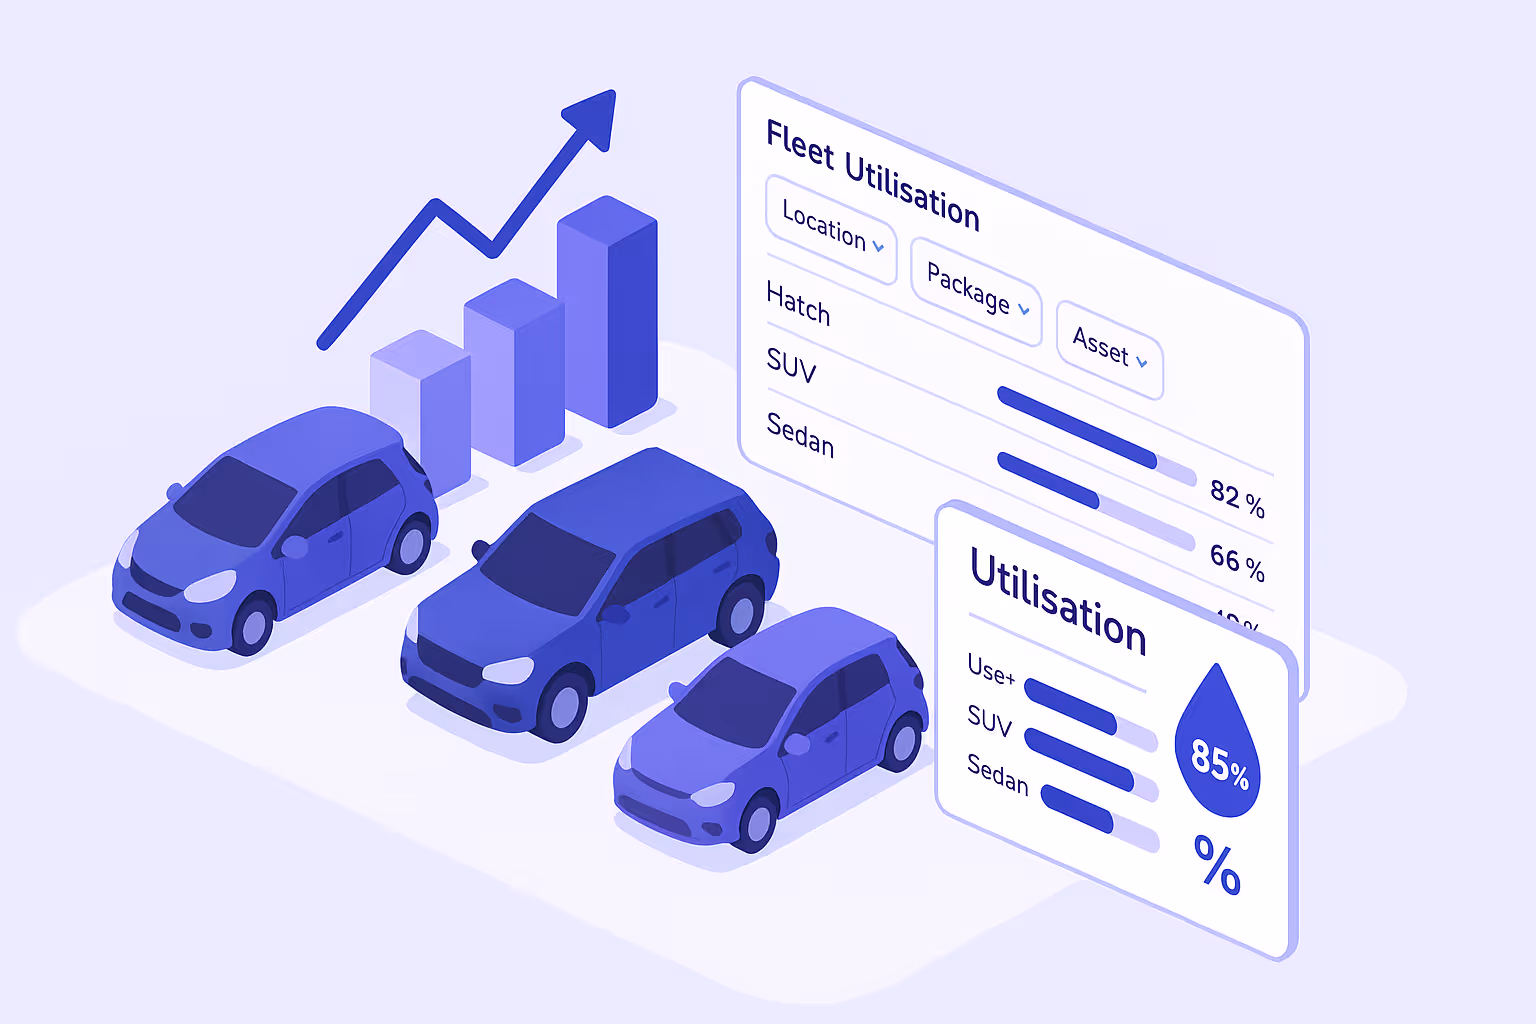
Fleet utilisation is one of the most important performance indicators for any fleet operator — and now, you can track it directly in Loopit.
The new Fleet Utilisation Report shows utilisation metrics for every asset based on the total number of available days and the number of days each vehicle was in use. You can view utilisation data at both the category level and for individual vehicles, giving you a clear view of which assets are approaching, meeting, or exceeding capacity.
The report mirrors your existing Loopit category structure, so utilisation is automatically grouped and displayed in a familiar hierarchy.
You can also apply advanced filters to refine your view — including by location, package, asset, date range, or status — making it easy to pinpoint trends or identify underperforming vehicles across your fleet.
When you’re ready to share insights, the entire report can be exported with one click for analysis or record-keeping.
With this update, you’ll have a complete picture of fleet performance at your fingertips — helping you maximise utilisation, reduce idle time, and make data-driven decisions that improve profitability.
.webp)

By using this website, you agree to the storing of cookies on your device to enhance site navigation, analyze site usage, and assist in our marketing efforts. View our Privacy Policy for more information.

